A picture of health: Visualising medical information for doctors
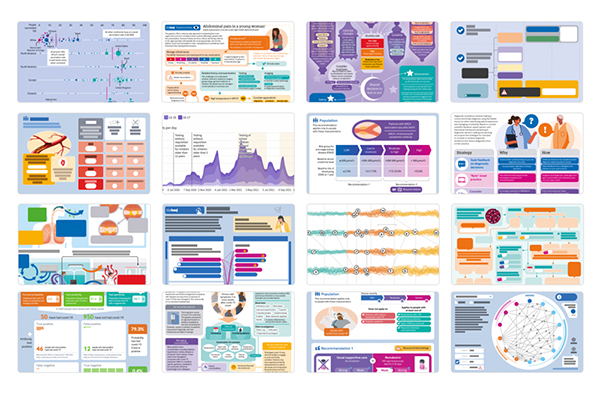
At The BMJ (British Medical Journal) we use infographics and data visualisations to convey the information we publish to busy health professionals in an efficient and engaging way. In my talk I’ll introduce the kinds of graphics we make, including full page “visual summaries”, interactive graphics, and visual abstracts.
Registration link to be updated shortly

Will Stahl-Timmins is Data Graphics Designer at The BMJ. His background is in graphic design. He holds a PhD in the use of information graphics in health technology assessment from Exeter Medical School. Outside work, he spends a lot of time playing with his daughter (currently age 2), cooking, gardening, and playing board games with anyone who he can get to the table.