16 June 2023, Aalto University, Finland – livestream available!
We’re going through uncertain times. In a complicated world where it seems that everything we encounter brings doubt and unpredictability, it is easy to forget that this can be a positive thing. Uncertainty makes way for possibility and opportunity. In pursuit of understanding and visualising the complexity that surrounds us, we can point out new perspectives and approaches that can bring a hopeful and optimistic future which hasn’t been set yet.
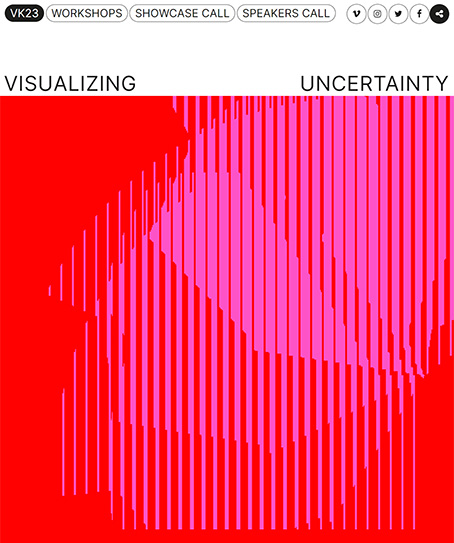
16 June 2023, Aalto University, Finland – livestream available
Visualizing Knowledge, a conference, a showcase and workshops, invites you to discuss and explore uncertainty in a new light. Let’s find prevalent questions and explanations through information design and Data visualization to unravel the complexity.
We’re going through uncertain times. In a complicated world where it seems that everything we encounter brings doubt and unpredictability, it is easy to forget that this can be a positive thing. Uncertainty makes way for possibility and opportunity. In pursuit of understanding and visualising the complexity that surrounds us, we can point out new perspectives and approaches that can bring a hopeful and optimistic future which hasn’t been set yet.
Join us to explore the role of information design in decision making in the context of the growing influence of AI. We’ll meet in Helsinki for talks and workshops with experts, researchers, educators, innovators, and enthusiasts to share profound knowledge through research, practice based design research, projects, questions and ideas to showcase what’s inside the black box.
How do we visualise the complexity of the world we’re living in? We are inviting experts and new talent alike to explore the unknown in everything between developing energy transitions, the growing presence of AI tools, ethical considerations in crisis reporting and the future of access to open science.
More information and registration