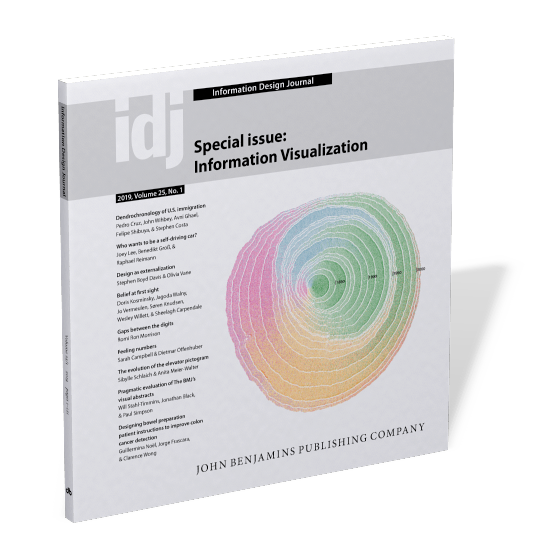
A special issue of the Information Design Journal with contributions by presenters of Information+ 2018 is now online under an open access license.
A special issue of the Information Design Journal with contributions by presenters of Information+ 2018 is now online under an open access license.
From the editorial by Marian Dörk & Isabel Meirelles:
We are very pleased to introduce the new Information+ Special Issue of IDJ, featuring nine peer-reviewed contributions which expand on the authors’ presenta-tions during the second Information+ conference, held on 19th–21st October 2018 at the University of Applied Sciences Potsdam (FH Potsdam) in Potsdam, Germany. The conference brought together 261 researchers, practitioners and students working at the intersection of information design and data visualization to discuss common questions and current challenges. Our main goal was to stimulate cross-disciplinary exchanges and knowledge sharing while nurturing research and innovation that is relevant to academia, industry and government.
She Ji, the journal for Design, Economics and Innovation, has published its issue 6/1, dedicated to design education and guest-edited by Guillermina Noël.
She Ji, the journal for Design, Economics and Innovation, has published its issue 6/1, dedicated to design education and guest-edited by Guillermina Noël.
The journal is open source, you can download the whole issue or select articles of your choice under this link:
Guillermina Noël University of Applied Sciences and Arts, Lucerne, Switzerland;
Michael Meyer and Donald Norman, University of California at San Diego, USA;
Peter Jan Stappers et al, Deft Technological University, Netherlands;
Gjoko Muratovski, Ullman School of Design, University of Cincinnati, USA;
Johan Redström, Umea Institute of Design, Sweden;
Gunnar Swanson, California State University, USA;
Jorge Frascara, Formerly University of Alberta, Canada, and now University of Applied Design and Art, Lucerne, Switzerland. He interviews Richard Buchanan, Meredith Davis, Ken Friedman, Willard McCarty, Ezio Manzini, Donald Norman, Sharon Poggenpohl, and Saskia Sassen.
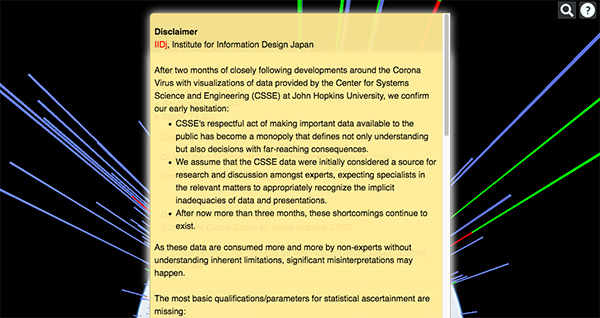
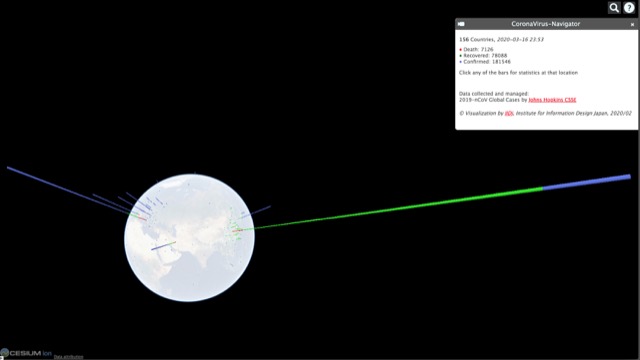
Comment by Andreas Schneider, Institute for Information Design Japan, on the quality of data provided by the Center for Systems Science and Engineering (CSSE) at John Hopkins University, basis for the “Corona Navigator” featured in a previous post.
Comment by Andreas Schneider, Institute for Information Design Japan, on the quality of data provided by the Center for Systems Science and Engineering (CSSE) at John Hopkins University, basis for the “Corona Navigator” featured in a previous post.
As these data are consumed more and more by non-experts without understanding inherent limitations, significant misinterpretations may happen.
The full comment is available on the IIDj website.
The Japan Sign Design Association Award (as known as SDA Award) was established in 1966 for the purpose of promoting and educating the public about the sign design through presentation of signature design works to the wide society.
The Japan Sign Design Association Award (as known as SDA Award) was established in 1966 for the purpose of promoting and educating the public about the sign design through presentation of signature design works to the wide society.
It continues to be the only award program for sign design in Japan. Signs today are considered as an interface that connects urban space or corporate activities with consumers, or as information that is indispensable for revitalizing the environment and establishing communication, and their examples are seen with more diverse variations.
The Japan Sign Design Association invites applications for awards from signature design works with high quality.
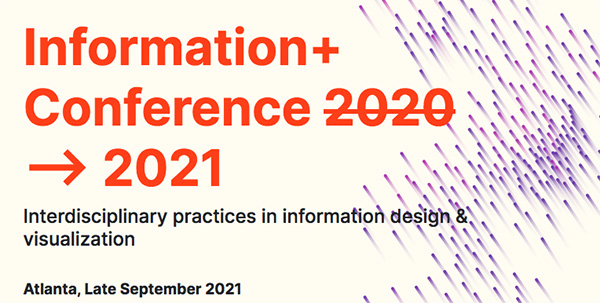
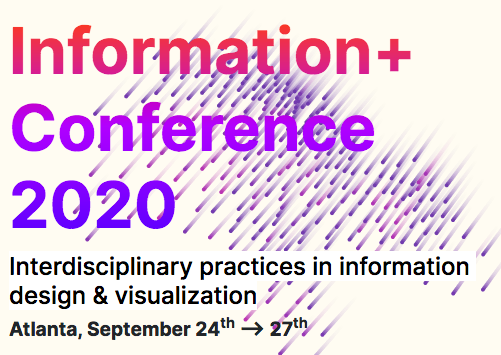
Information+ has been postponed for one year, until fall 2021.
Hopefully, in the fall of 2021, a new version of the conference at Georgia Tech will be carried out with as many of the existing components as possible.
There is one positive update: the special issue of the Information Design Journal with contributions by presenters of Information+ 2018 is now finally online under an open access license: https://benjamins.com/catalog/idj.25.1
Extraordinary times require extraordinary measures. Under the given circumstances we have made some changes and adaptations.
Extraordinary times require extraordinary measures. Under the given circumstances we have made some changes and adaptations.
The jury meeting is postponed to May 15/16, will be held face-2-face or online, depending on current developments.
The category “emergency” is dedicated to covid-related entries for only 30,- euro each.
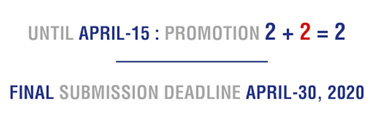
Until April-15, there is a 2+2=2 promotion.
The final deadline for submissions is April-30.
Awarded projects will be announced on May-19.
The IIIDaward-book will be thicker than ever.
The IIIDaward exhibition tour will be expanded to as many as possible places.
Let us show the world the impact of excellent information design. If you have any further suggestions, ideas, please contact us.
The more, the better: our ambition is to have as many cases as possible giving evidence of the importance and relevance of information design. So please submit two entries and get two more for free. Promotion ends on Wed. -15th of April.
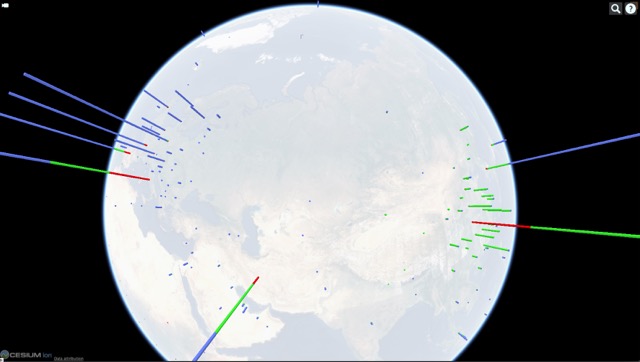
Although we are constantly updating and expanding our visualizations around the developments of the spread of the Corona virus, we are painfully aware of the underlying limitations and the risks of statistical communication.
Although we are constantly updating and expanding our visualizations around the developments of the spread of the Corona virus, we are painfully aware of the underlying limitations and the risks of statistical communication. Numbers, exuding a certain authority, may draw attention in ways that are not appropriate to the issues they claim to represent.
While it is extremely important to put quantitative information in context, we lack the detail to do so in a meaningful way: the number of tests performed, population, demographic profiles and many others.
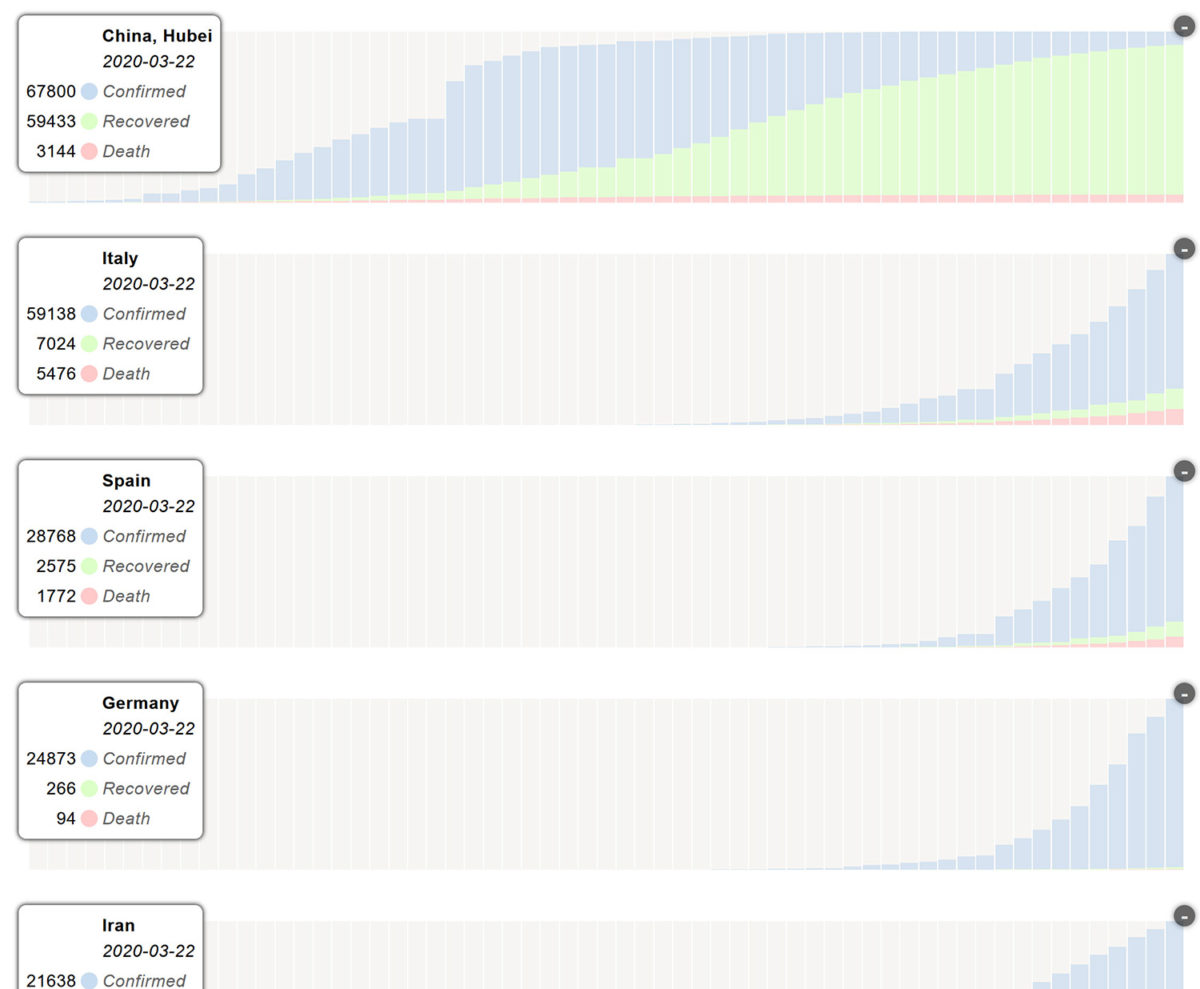
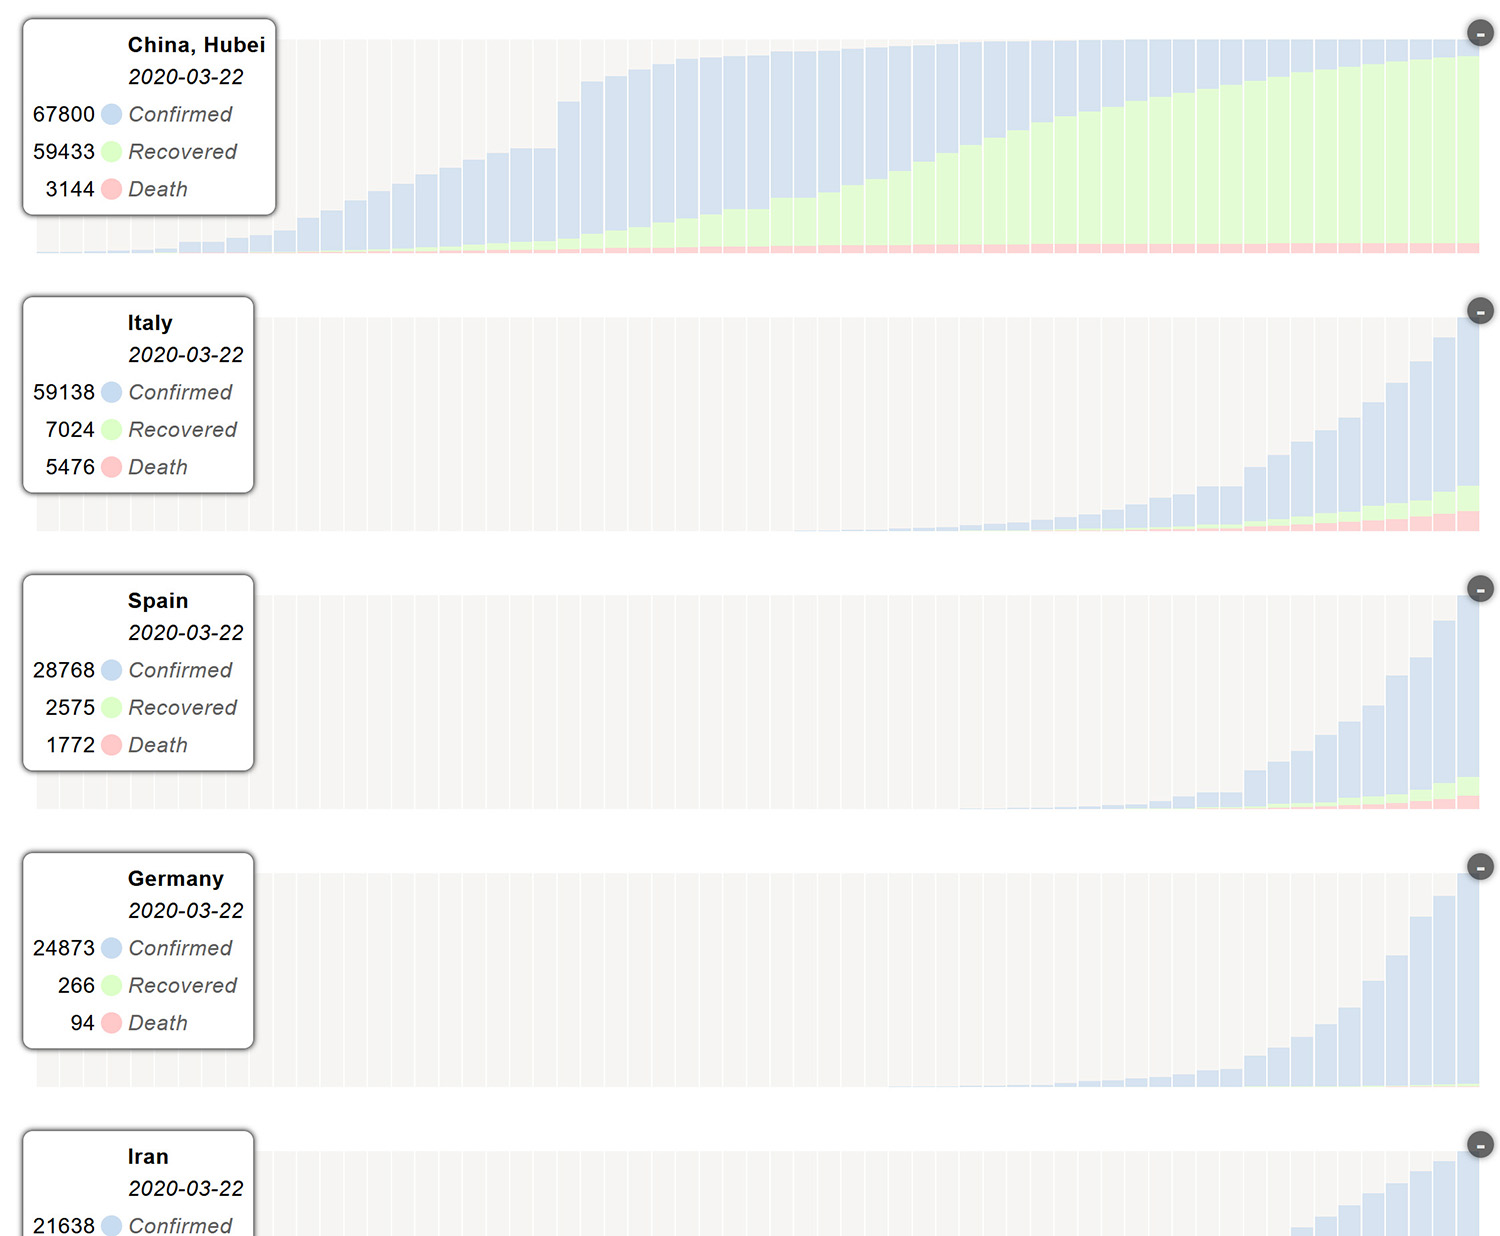
We have added a new view, charts, which should help to better understand the dynamics of development at each location. These diagrams are scaled to facilitate comparative reading – they do not allow quantitative comparisons in any way.
We have added a new view, Charts, which should help to better understand the dynamics of development at each location. These diagrams are scaled to facilitate comparative reading – they do not allow quantitative comparisons in any way. https://api.iidj.net/cv/charts
Data collected and managed by Center for Systems Science and Engineering (CSSE) at John Hopkins University – Great Work! https://url.iidj.net/arcgis_75MX
Andreas Schneider Institute of Information Design Japan iidj 2020-03-23.
Abstract submission deadline has been extended, we are currently working on a new timeline.
Navigating the City 2020 in Mumbai
Information and mobility design for high-density multilingual environments 6-8 November 2020, Mumbai, India Abstract submission deadline has been extended, we are currently working on a new timeline.
Our aim is to make sure that the event will take place, either in Mumbai or as a virtual conference.
Andreas Schneider from IIDj, Institute for Information Design Japan sent this article.
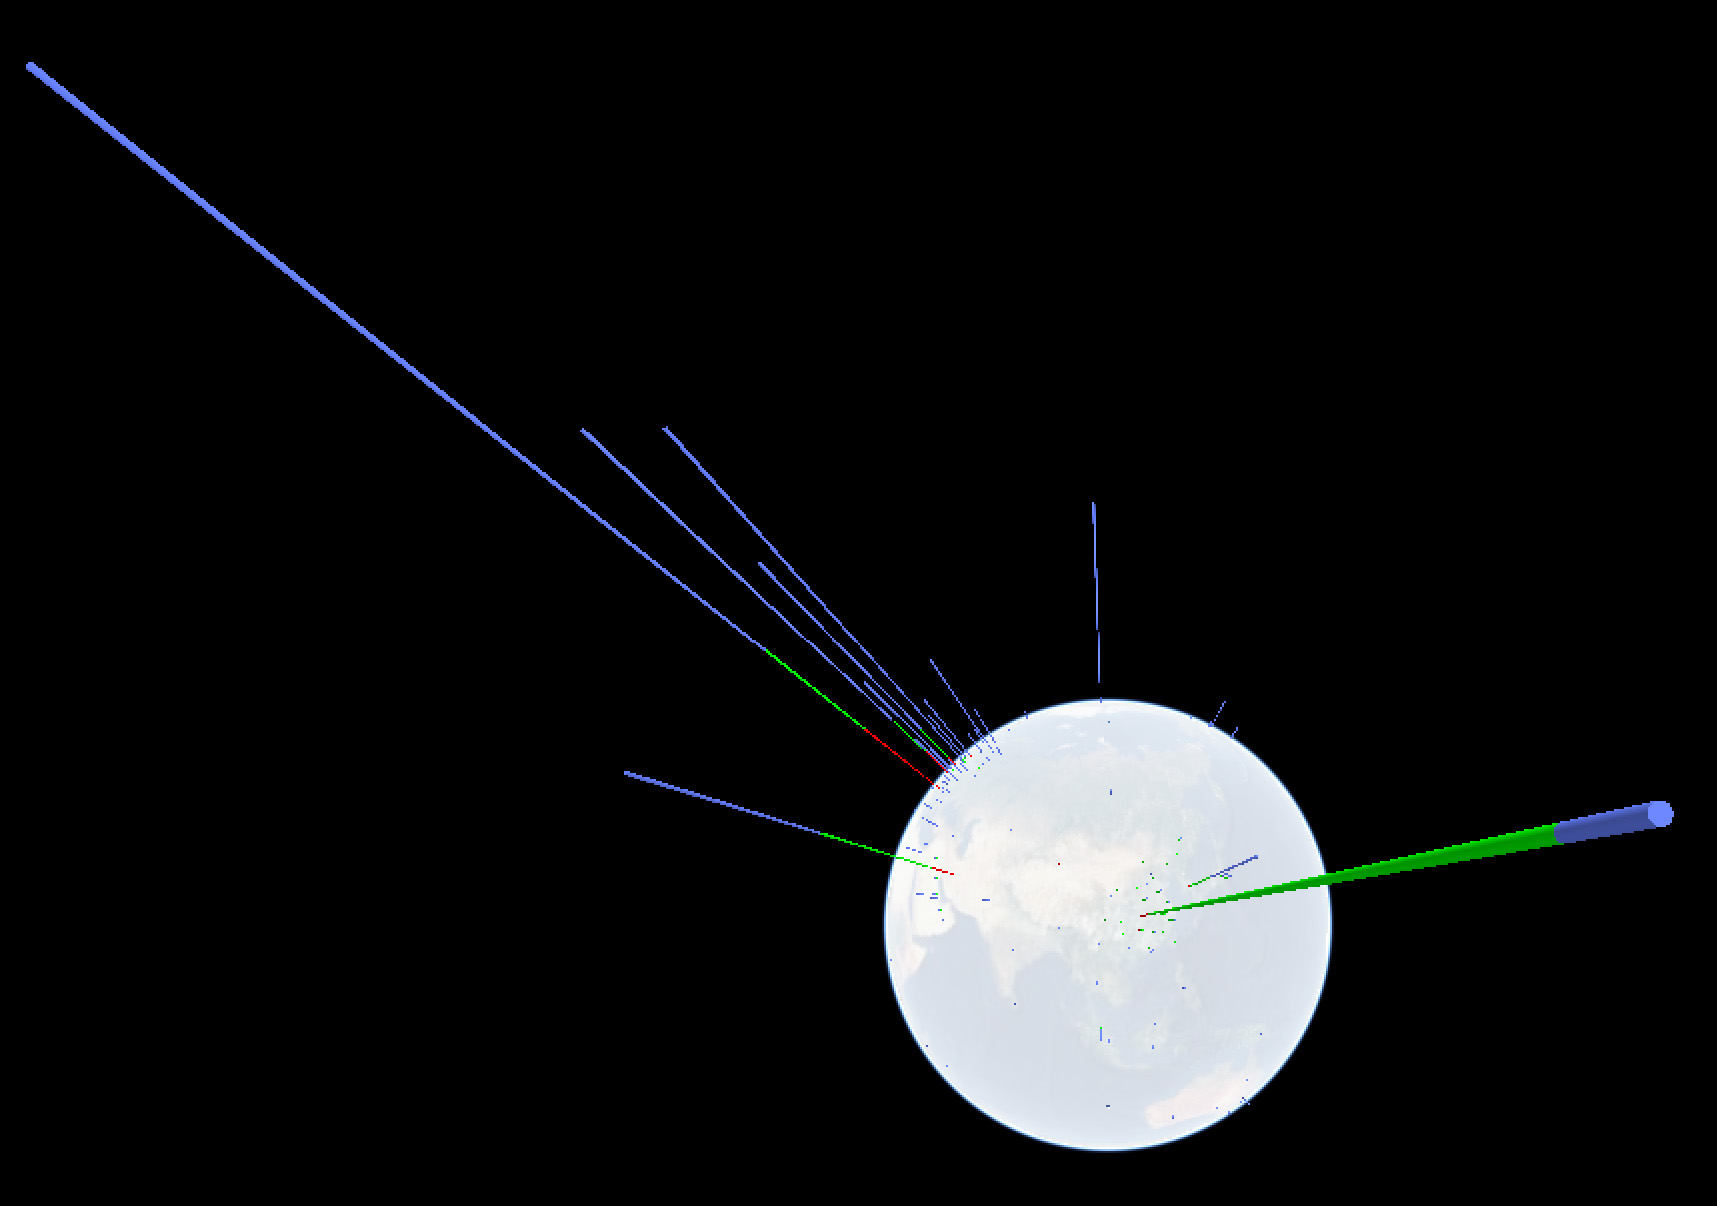
Corona virus navigator: IIDj keeps a live 3-D visualization of the virus’ geographic appearance within the limitations set by insufficient data, based on the LiveTracker of the Center for Systems Science and Engineering (CSSE) at John Hopkins University, US
Following the development of presentations around the coronavirus evolution we feel obliged to raise our concerns:
Numbers are only meaningful if they refer to a known metric – the sum of the identified infections must be reported together with the total number of persons testedpresentations have to consider and communicate three phases: IDENTIFICATION, RECOVERY, FATALITIES.
Data should be provided by SITES, identifiable significant agglomerations / communities – and not by arbitrary political entities – such as province or country.
The number of cases cannot be visualized as blobs of varying size on 2-dimensional maps, giving the impression of a geographical spread when the underlying data is the total within an arbitrary political boundary – such as province or country.
Color schemes should enable understanding rather than cause fear.
AUTHORSHIP/SOURCE of data/information used must be clearly stated, including contact details for questions and feedback.
We keep updating the live 3-D visualization of the virus’ geographic appearance within the limitations set by insufficient data, based on the LiveTracker of the Center for Systems Science and Engineering (CSSE) at John Hopkins University, USA. https://api.iidj.net/cv/ https://api.iidj.net/cv/timeline
We hope that the respective authorities will make efforts to provide appropriate data in a consistent format. This is necessary for responsible decision-making at personal and political levels that can count on the understanding of all concerned.
Data collected and managed by Center for Systems Science and Engineering (CSSE) at John Hopkins University. https://url.iidj.net/arcgis_75MX
Context, worldwide: According to WHO, 15 deaths every minute = 8MIO per year through AIR POLLUTION https://url.iidj.net/who_ghZS According to WHO, 15+ deaths every minute = 8MIO+ per year through TOBACCO USE https://url.iidj.net/who_7745 According to WHO, 3 deaths every minute = 1.6MIO per year directly caused by DIABETES (2016) https://url.iidj.net/who_HL21
September 30th – October 2nd 2020 The Watergate Hotel, Washington, USA
Clarity 2020 focuses on Access for All to include access for any person to justice systems, health-care choices, financial decisions, opportunities, technology, and much more.
This one-day conference VK20 questions how we can make democracy more visual, and thereby, enabling more people to be informed participants in democracy.
15 categories, entries from around the world, an international jury, and a great track record for high quality competition. We don’t just give it away, folks! Entry deadline: 18 March 2020 Be a winner
2019 Christian Lunger and Markus Scheiber started a series of (mainly German) conversations about orientation, spacial design, and information. Well worth listening to!