Legal Information Design: Towards user-friendly contracts
“I have read and understood the terms and conditions” is the biggest lie on the internet – no one reads, and definitely no one understands (except the lawyers).
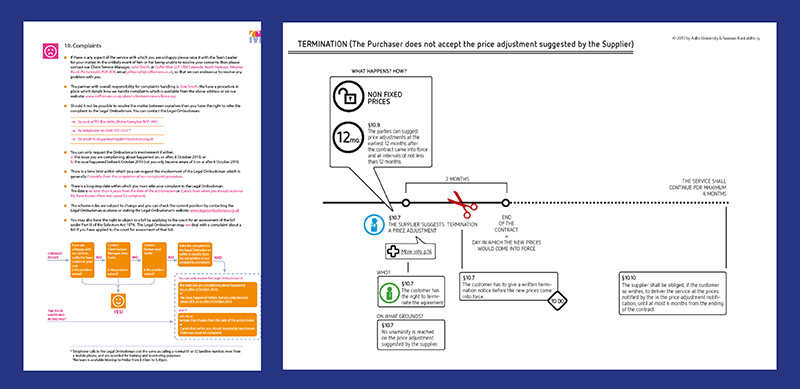
When most of us hear “contracts”, we think of impenetrable walls of legalese envisioned to protect a party at the expense of the other. But there’s another way. Through information design, contracts can be transformed into tools that work better for business, for people, and ultimately for society.
Stefania Passera, a pioneer of contract design, will show examples of her work and discuss the impact of this new, multidisciplinary approach to contracts. Legal information design is a fast-growing marketplace for information design skills and this talk will introduce IIID members to one of its leading figures.

Stefania, founder of Passera Design, is an information designer specialized in contract design and simplification based in Helsinki, Finland. With 10+ years of experience in the field, she is considered a true legal design pioneer. She collaborates with World Commerce & Contracting as Contract Designer in Residence and as curator of the Contract Design Pattern Library.
She has served as an Assistant Professor at the University of Vaasa, Department of Business Law (Finland), and earned her doctoral degree from Aalto University (Espoo, Finland). Her research has been published internationally, and she is an in-demand speaker and lecturer on contract and legal design. Her impact as a legal design pioneer has been recognized with a European Women of Legal Tech 2020 award and a WorldCC Fellowship.