Open for submissions until 25 March 2023. The IIIDawards are a showroom for professional information design with international exposure in many different categories of information design applications.
The IIIDawards are a showroom for professional information design with international exposure in many different categories of information design applications. In addition to receiving an award, all submissions are presented online. The best of each category are included in the IIIDaward book and will go on tour as part of the exhibition.
What do we know about an issue? What really is knowledge compared to the actual practice? Shedroff’s theory states that data leads to information, information leads to knowledge, and knowledge leads to wisdom of an individual.
What do we know about an issue? What really is knowledge compared to the actual practice? Shedroff’s theory states that data leads to information, information leads to knowledge, and knowledge leads to wisdom of an individual. What role can visualization play in this? How can visualizations lead to new knowledge? In what ways can we create knowledge?
In our next event we want to explore the question whether visualizing knowledge could be the key to faster understanding, inclusion and a new form of learning and discussion. Let’s visualize the given and the imagined to create knowledge for the future.
The next event will be in English only on YouTubeLive. You will be able to ask questions via Slido. IMPORTANT: Please RSVP for the event, so that we can send you the online link and additional information.
And here are the speakers: Barbara Vissirini, a Berlin based communication designer, will talk about her latest award winning project – Dieses kleine Buch ist für dich: A visual grammar for German as a Foreign Language. She will share with us the basics behind her design research and the developed visual system. We are curious to see if this book could be a first step into learning new languages with fun and visual logic. Valentina D’Efilippo, a London-based designer, illustrator and creative director. Whose work has been part of the permanent collection of Austria’s largest anthropological museum, the Weltmuseum Wien, and her book “The Infographic History of the World” has been translated into nine languages. Valentina will talk about her latest projects and her experiences with illustrating history and human development through data visualization and infographic storytelling. Dario Rodighiero, is an Assistant Professor of Sciences and Technology Studies at the University of Groningen, a principal of metaLAB (at) Harvard, and a member of the Berkman Klein Center for Internet & Society. As an interdisciplinary researcher and designer, Dario will take us to the intersection of knowledge design, critical data, and digital humanities, focusing on the creative possibilities of visualizations and the digital mapping of knowledge. Darjan Hil from Superdot will host the next On Data And Design online session live on Youtube.
Drawing from the best minds and voices in the information design field from across the globe, Visualizing Knowledge is a one day data visualization conference held at Aalto University, Finland.
Visualizing Uncertainty: Call for speakers and student showcase now open
JOIN THE SHOWCASE! Student Projects of Information Design and Data Visualization
Visualizing Knowledge is seeking for engaging and compelling student projects to be part of the showcase exhibited online and on the conference day, 16th June 2023, at Aalto University. This year’s theme is Visualizing Uncertainty. How can we point out new perspectives and approaches that can bring a hopeful and optimistic future which hasn’t been set yet? How do we visualize the complexity of the world we’re living in?
Entries can be design and data work in a variety of formats – digital, web, interactive art, installation and print etc.
Selected entrants will have the opportunity to attend the conference for free.
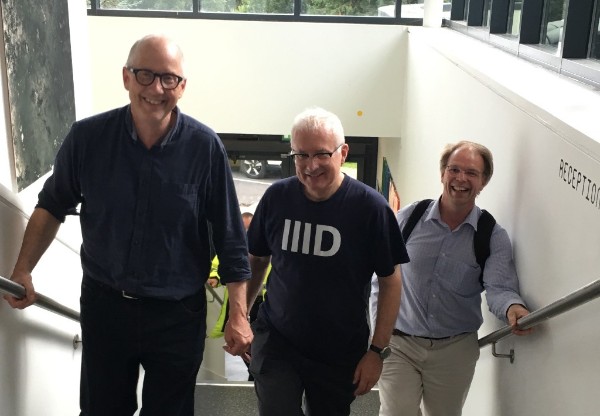
After two years online, the Information Design Summer School is face-to-face again – for three intensive days of expert talks, discussion and practical work.
After two years online, the Information Design Summer School is face-to-face again – for three intensive days of expert talks, discussion and practical work in Vienna, just before Vision Plus XIX. There are sessions on design critiquing, visualisation, typography, language and design, iconography, and user testing.
It costs £250, and there are various discounts available. You can find out more at: The Simplification Centre
The IIIDawards are a showroom for professional information design with international exposure in many different categories of information design applications.
The IIIDawards are a showroom for professional information design with international exposure in many different categories of information design applications. In addition to receiving an award, all submissions are presented online. The best of each category are included in the IIIDaward book and will go on tour as part of the exhibition.
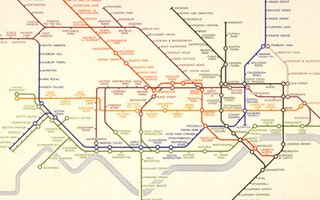
We’re marking the 90 year anniversary of the London Underground network diagram with a talk by Maxwell Roberts, who is the pre-eminent expert on the diagram and author of several books on it.
Why Henry Beck’s 1933 London tube map design was such a resounding success
It’s exactly 90 years since the launch of Henry Beck’s 1933 London Underground network diagram, which has become an iconic example of information design . We’re marking this with a talk by Maxwell Roberts who is the pre-eminent expert on the diagram and author of several books on it.
Max says: “It was a remarkable work of elegant compromise, effortlessly balancing conflicting priorities and presenting passengers with a design that simplified reality in a useful way. In this talk I will highlight these priorities and consider recent findings in usability testing that show the importance of attending to them.”
Maxwell Roberts lectures in psychology at the University of Essex, UK, with BSc and PhD degrees from the University of Nottingham. His research interests have included reasoning and intelligence, but now focus on information design and, in particular, schematic maps, creating challenging designs and testing their usability and aesthetics. He has authored four books and several academic papers on this topic and co-chairs the Schematic Mapping Workshop. His personal web page is www.tubemapcentral.com.
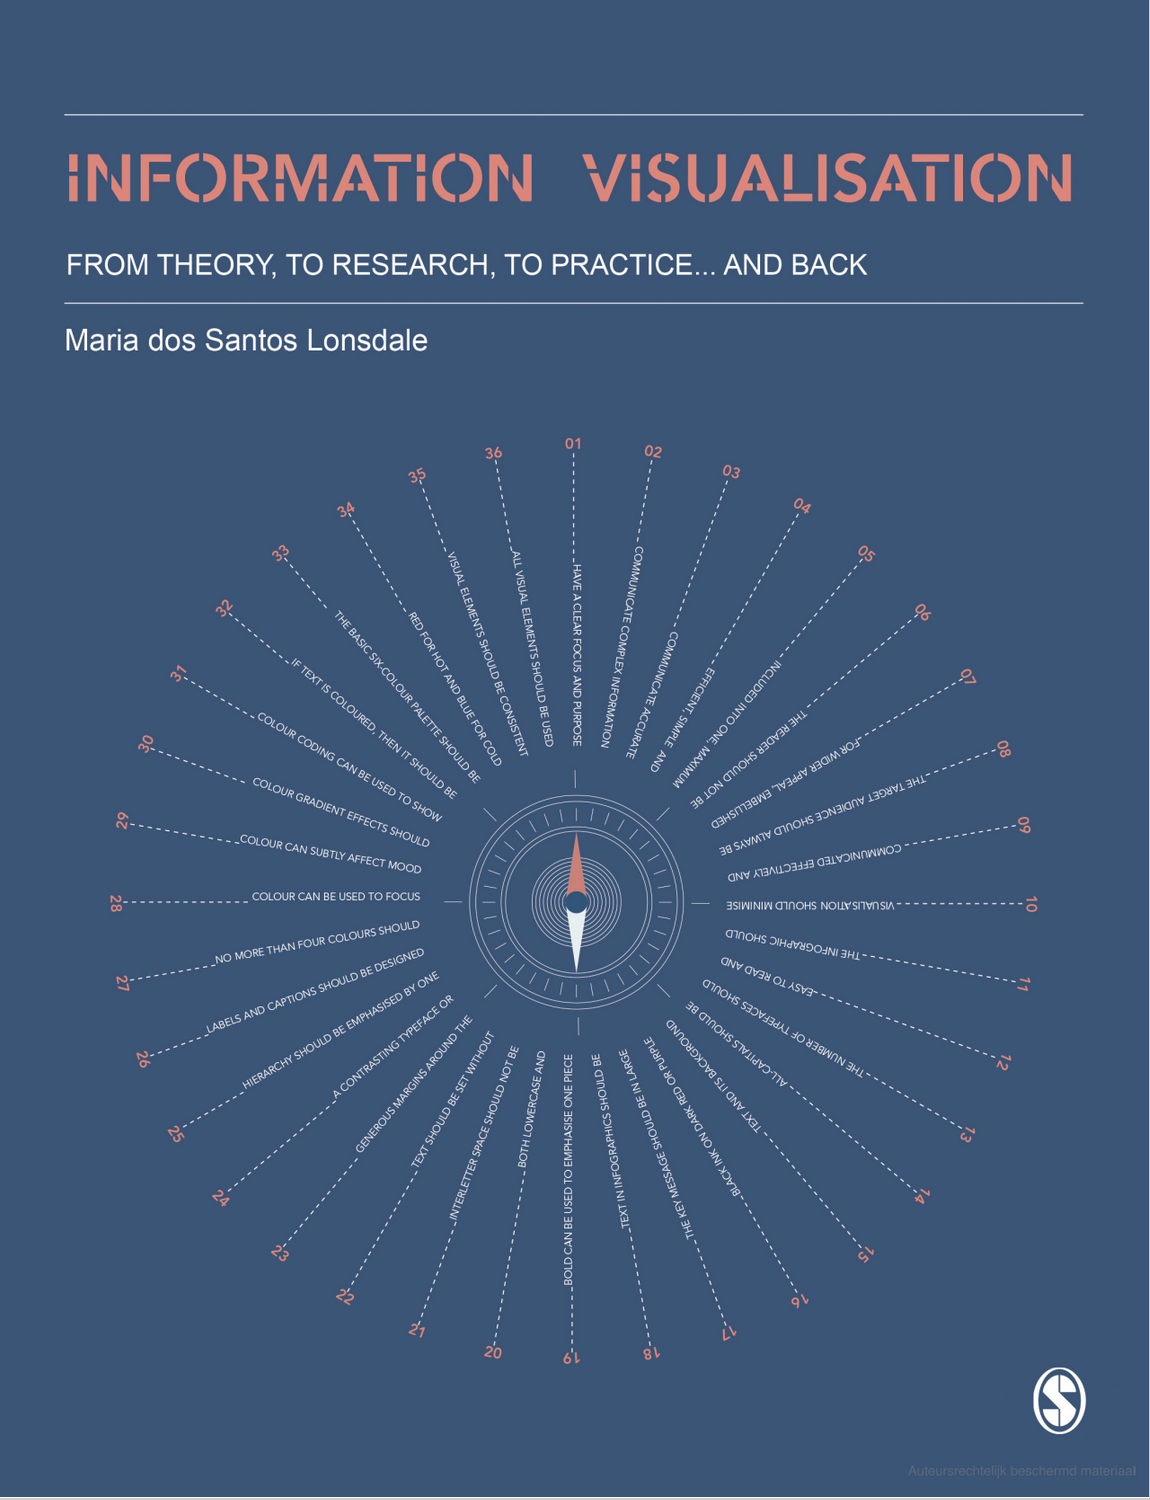
New book by Maria dos Santos Lonsdale about ‘Information Visualisation’.
The publisher states: ‘In a world of information overload, this book will help you to cut through the noise and communicate information with clear, efficient, and engaging visualisations.
This book:
• Explains the principles behind information visualisation, including the science of visual perception and cognition • Provides guidelines that bring research and best practice together • Showcases a range of examples, and outlines the do’s and don’ts of different approaches • Shows how to use research methods to design with and for your target audience.
From an expert with years of experience researching, teaching, and doing information visualisation, learn how to make better and informed decisions around visualisation design that are appropriate for both your data and audience.’
Rodrigo Ramírez will talk about “Visual Tools: Information design as a way to manage crises and emergencies.”
Visual Tools: Information design as a way to manage crises and emergencies.
Rodrigo Ramírez specialises in information design for emergencies, including the immediate needs in an emergency as well as the communication and management of risk. He will discuss the Guemil icons project, with testing through participatory workshops in communities.
Rodrigo is Associate Professor at the School of Design, UC Chile (Diseño UC). He is also a researcher at the Chilean National Research Center for Integrated Disaster Management, CIGIDEN. He was design leader for the Guemil Icons project, an open source set of symbols for crises and emergencies (guemil.info). Rodrigo has an MA Information Design from Reading University, UK. His interests are typography and information design, crossing both practice and research. He has collaborated in information and type design research and designed for brands, public organizations, and publications.
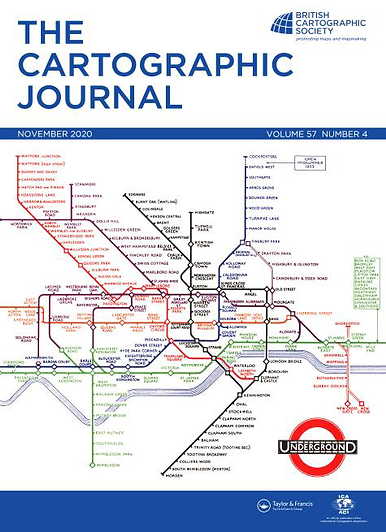
In 1933, Henry Beck’s original design for representing the London Underground was published, schematising the entire network for the first time using only horizontal, vertical and 45-degree diagonal lines and distorting topography to enhance clarity. The London Underground has been depicted using these techniques ever since and cartographers and designers worldwide have been influenced by its success.
To mark this anniversary and Beck’s contribution, The Cartographic Journal will publish a multidisciplinary Special Issue exploring the foundations and future prospects for transport cartography in which schematisation forms an important element of design.
We welcome full contributions of up to 8,000 words (Refereed paper – substantive research – with double-blind peer review) or shorter manuscripts of up to 4,000 words (Observation paper – brief reports of preliminary findings or theoretical remarks – with editorial review) that either focus on Beck’s work and its legacy or take a wider perspective.
Issue 19.3 of the Revista Brasileira de Design da Informação contains 4 English articles about health and wellbeing.
The Brazilian journal InfoDesign has just published a special issue on Health and Wellbeing. Issue 19.3 of the Revista Brasileira de Design da Informação / Brazilian Journal of Information Design contains five articles in English. PDFs of these articles can be downloaded for free from the InfoDesign website.
Co-founder and Director, Design for All in Austria IIID Vice President, Finance & Administration
What is the motivation to work in information design?
I feels good to create something that improves someone’s experience or understanding.
What are you working on at the moment?
Wayshowing, orientation, medical information.
What is a project you consider a great example of information design?
Paris public transport, the new bus stops; Telebanking in India with voice interaction only; (Wayshowing in Hofburg Imperial Palace Vienna and Austrian Parliament); my latest project 🙂